Aug 2026 – present
Order-level liquidity around the EIA releases
Every Wednesday (petroleum) and Thursday (natural gas storage) at 10:30 ET, the U.S. Energy Information Administration (EIA) publishes a weekly report at a known second. I asked where displayed liquidity goes, order by order, around it. For a market maker, this is the book you quote into and re-enter.
What I did
I rebuilt the displayed order book of NYMEX crude oil (CL) and Henry Hub natural gas (NG) futures from CME market-by-order (MBO) data, which tags every add, cancel, modify and fill with its order ID; market-by-price (MBP) data show only total size per price. The sample is 29 petroleum and 31 gas releases, March to October 2026 (the 209 core March to September files, release and control days up to 12:30 ET, hold about 440 million MBO records).
Each release is compared with four matched control days: the nearest Mondays, Tuesdays or Fridays with no EIA or listed macroeconomic release between 10:00 and 11:00 ET, at the same clock time.
Two outcomes are primary. After the release: the shortfall of near-mid depth (displayed volume within 5 ticks of the mid-price) below the day's own pre-release level, summed over the 300 seconds after the price reaction, in seconds of fully missing depth. Before it: the depth withdrawn at the touch (best bid and ask) in the final two minutes, split into cancels, executions and missing new orders (adds below the normal rate).
The pre-registered plan was frozen before the confirmatory data were opened; one confirmatory analysis followed, with deviations listed in the paper.
What I found
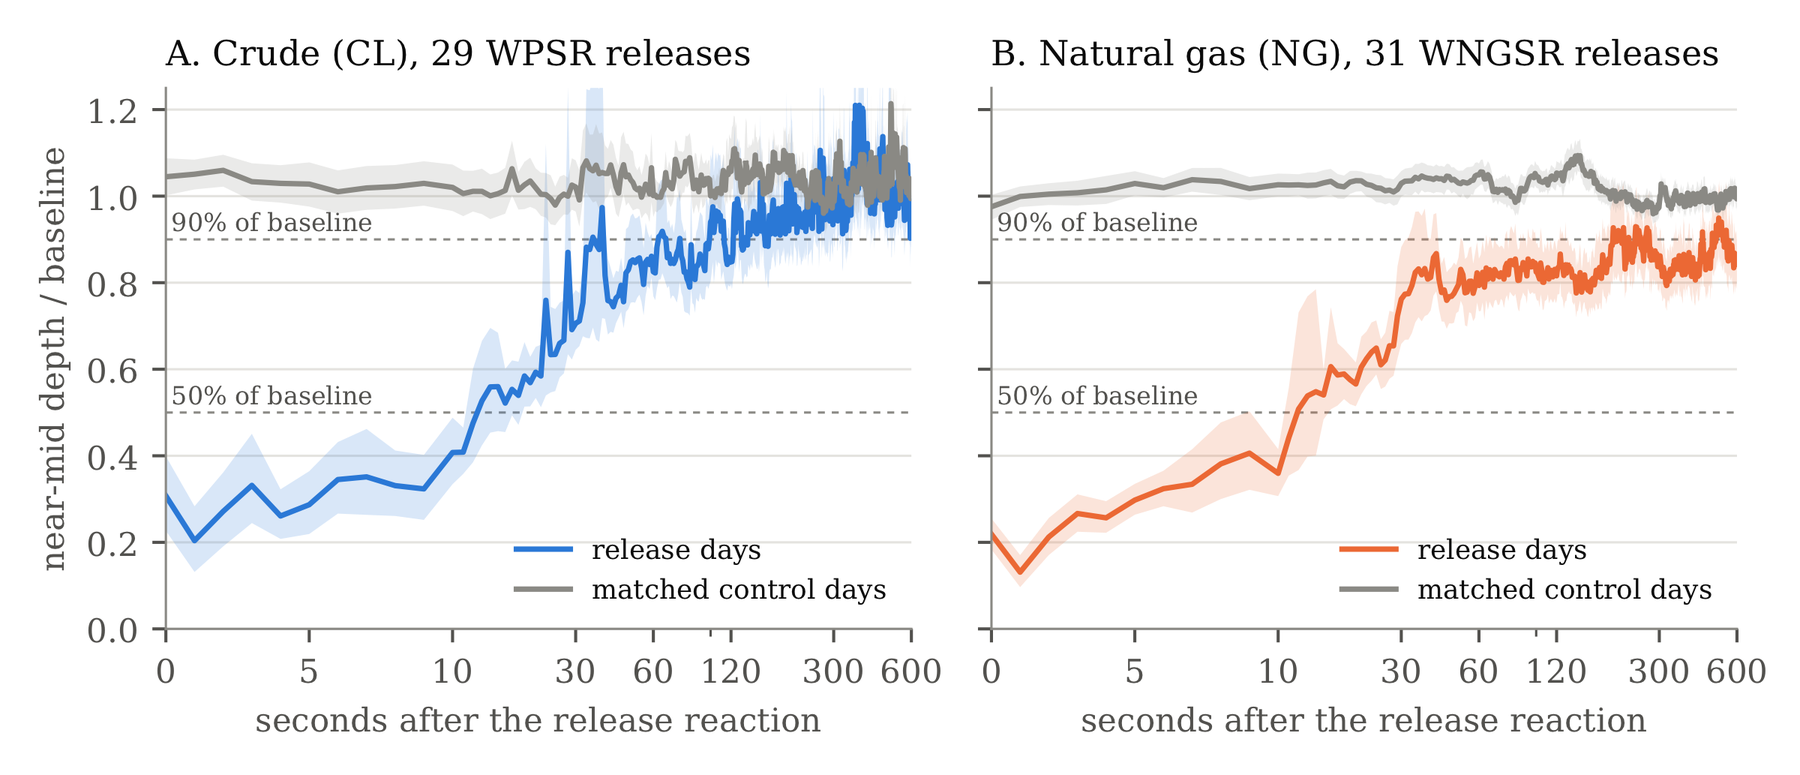
After the release, near-mid depth stays depleted. Over the first five minutes, crude has the equivalent of 33.8 seconds of fully missing near-mid depth beyond matched days (95% CI 23.5 to 44.6; positive on 25 of 29 releases), and gas 48.3 seconds (35.3 to 61.6; 28 of 31). Against non-release price moves of similar size the gas deficit holds; in crude about half of it does (exploratory). In the recovery curves above (also exploratory), depth is about 40% of its pre-release level 5 to 15 seconds after the reaction; crude is back to its control level within about five minutes, while gas stays about 10% below control for 10 to 20 minutes.
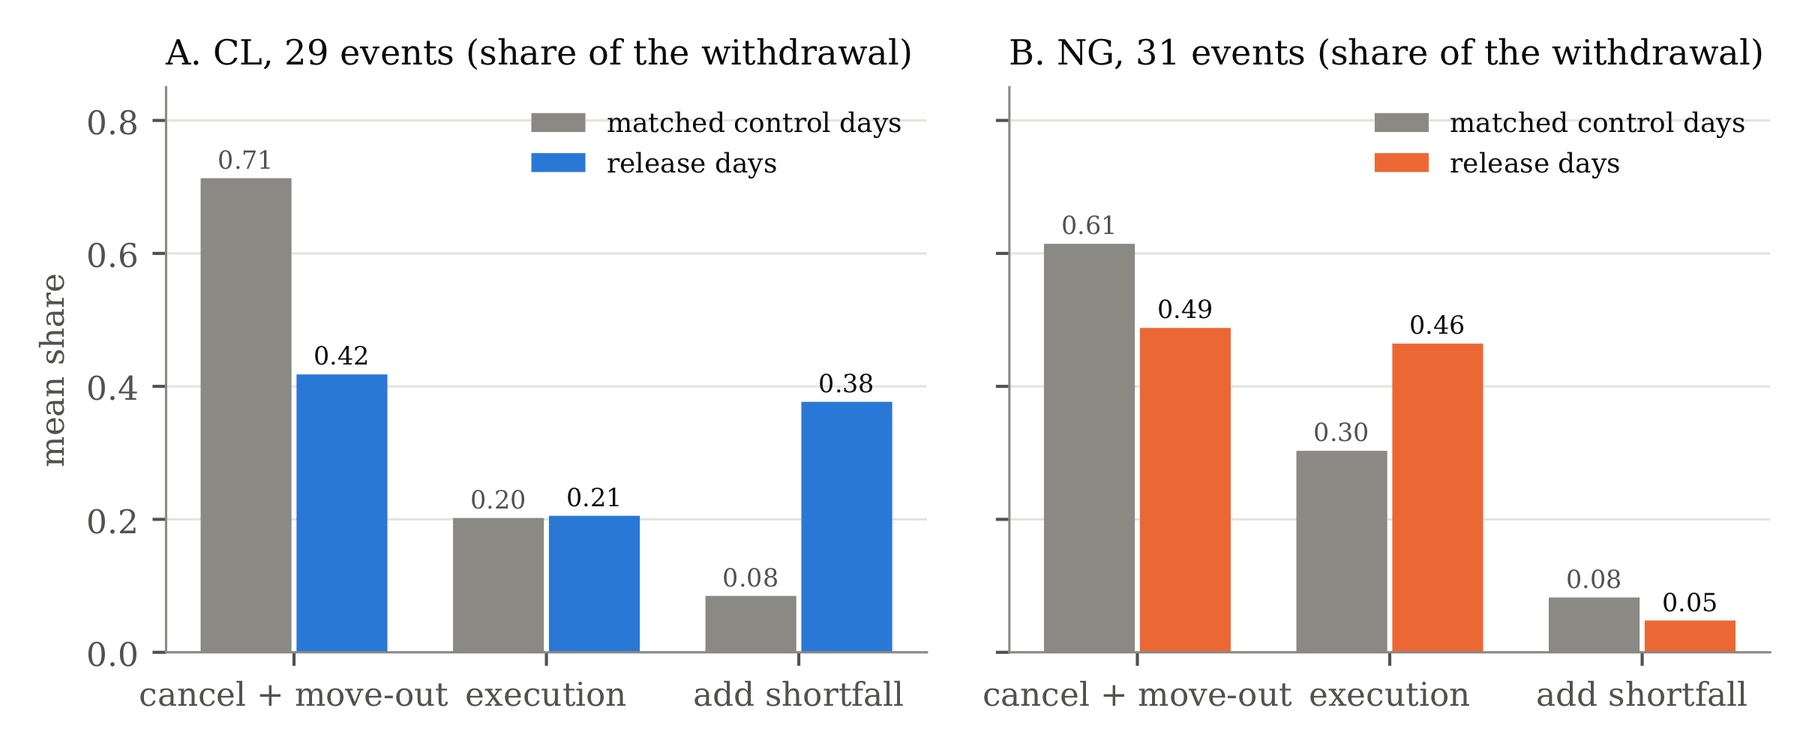
Before the release, the touch thins without the extra cancellation I had hypothesized. Before crude releases, cancellations make up a smaller share of the touch withdrawal than on matched days, and missing new orders take up the slack, becoming about as large a channel as cancels (0.38 vs 0.42). Adds and cancels at the touch both roughly halve (post hoc): the touch goes quiet. About 60% of the crude contrast also appears at 10:30 before the gas report, so I call it a pre-EIA-report effect at 10:30, not specific to the petroleum report. Before gas releases, more resting orders execute instead (post hoc).
What failed and what it does not show
Release days are Wednesdays and Thursdays and control days Mondays, Tuesdays and Fridays, so the design cannot separate an EIA effect from a mid-week 10:30 effect.
Several pre-registered placebos failed. At 10:30 on gas-report days, micro crude, gasoline and heating oil show pre-release contrasts nearly as large as or larger than on petroleum days (a market-wide 10:30 response under the frozen rule), and about a third of the crude post-release deficit appears there too. In gas, about half the pre-release contrast shows up at the 12:00 placebo clock, with small post-release residues at 11:30 and 12:00. The timing placebo (a 12:00 petroleum report) was confounded by a 10:30 gas report.
Depth is displayed outright only (no implied orders or hidden iceberg size), cancels are absolute volume, not per resting lot, and the sample is seven months, about 30 releases per product.
Reproduce it
The analysis code is private, and the CME market data are licensed and cannot be redistributed, so the results themselves cannot be rerun from public materials. The engine the study runs on, mbo-queue, is public (version 0.6.0 for the primary results). Its tests and a known-answer check on a synthetic CME-style exchange run from a clone:
pip install "mbo-queue[data]"
git clone https://github.com/AnshDani2004/mbo-queue
cd mbo-queue
python tests/test_mboq.py
python scripts/synthetic_validation.py
Status. Working paper, version 1, on SSRN. Planned: one analysis of the out-of-sample releases from October 12, 2026 onward with the frozen code, and a weekday placebo on a non-energy CME product.